Data
We believe that openness and accountability is important as we all work towards meeting the challenge of climate change.
This page contains the Broads Authority data on our Greenhouse Gas Emissions, and the modelling for the wider Broads National Park.
Broads Authority Emissions
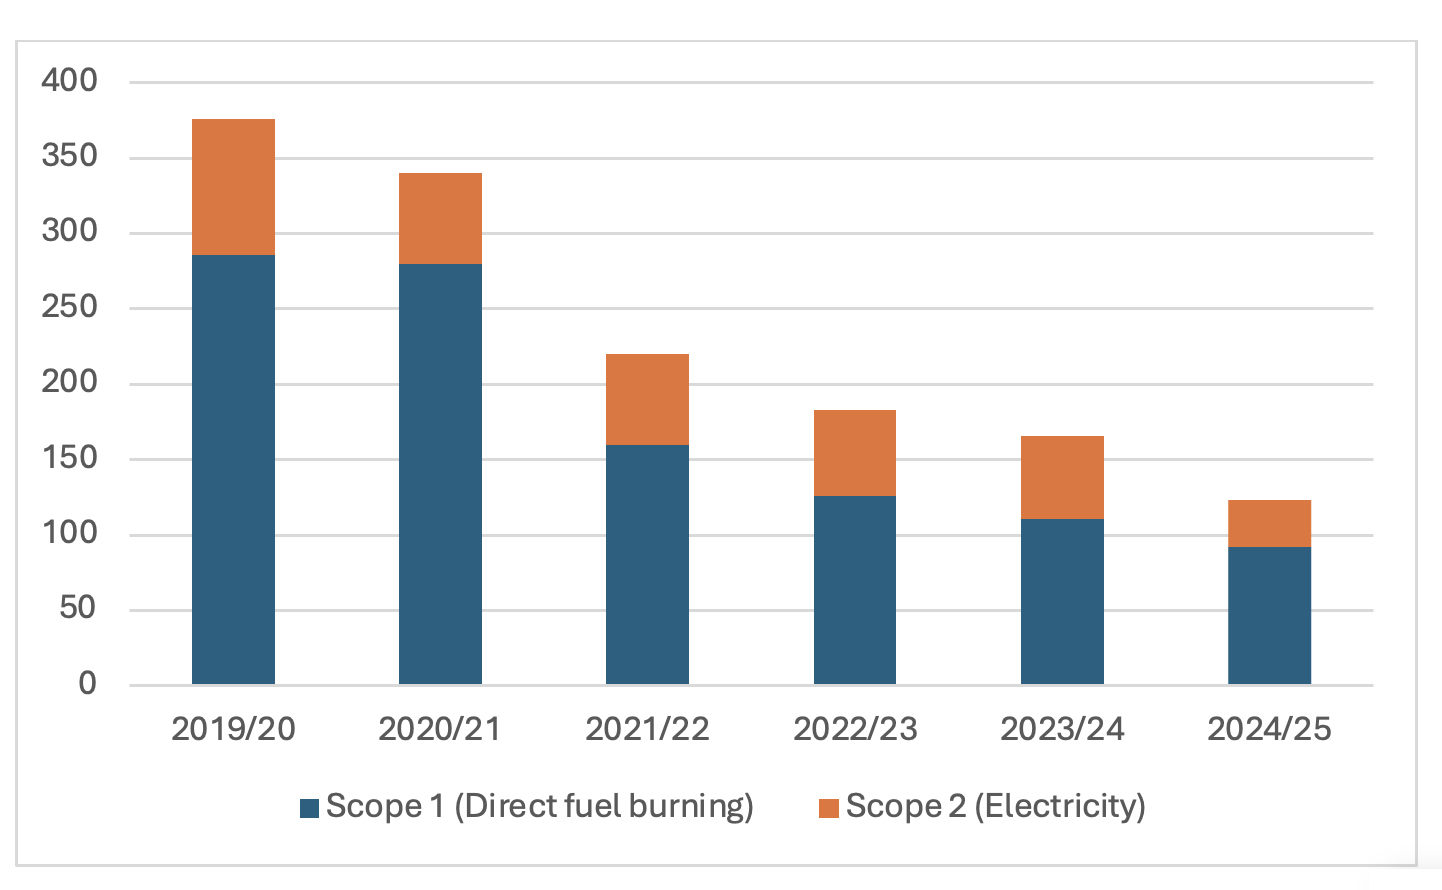
Broads Authority Scope 1 and 2 Footprint estimate. Scope 1 emissions are those that are directly emitted from Broads Authority equipment, such as burning fuel in heating systems.
Source | TCO2e 19/20 | TCO2e 20/21 | TCO2e 21/22 | TCO2e 22/23 | TCO2e 23/24 | TCO2e 24/25 |
|---|---|---|---|---|---|---|
Fuel | 283 | 277.5 | 158 | 124.4 | 109.6 | 89.9 |
Heating Oil | 2.5 | 2.3 | 2 | 1.3 | 1.3 | 2.4 |
Electricity (Grid) | 90.37 | 60.25 | 60.25 | 57.33 | 54.88 | 31.17 |
Grand Total | 379.6 | 340.05 | 220.25 | 182.33 | 165.78 | 123.77 |
% Change Year on Year | - | 10% | 35% | 17% | 9% | 25% |
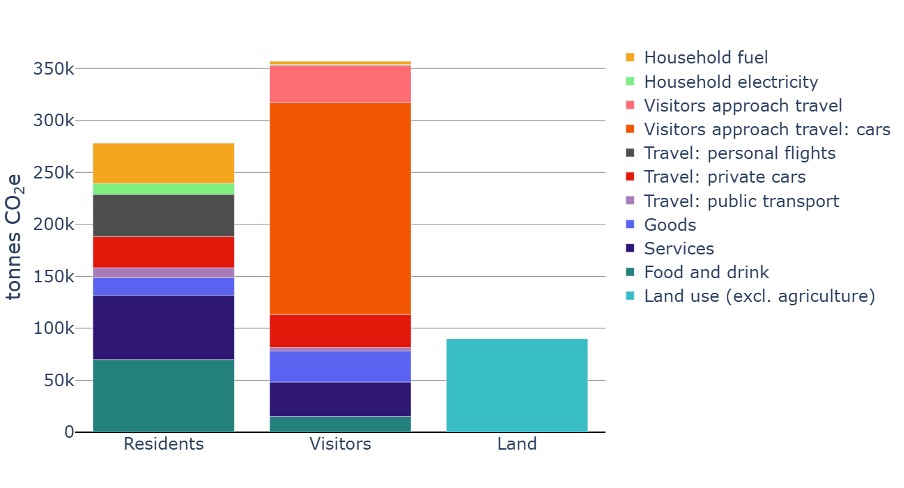
Wider National Park Footprint
The wider National Park footprint is updated annually by our contractor, Small World Consulting Ltd. As it requires a large amount of datasets to become available, there is a lag to this data. Currently the most recent data we have is for 2023.
These figures are based on the a “consumption” footprint basis, which considers the full carbon footprint of supplying something, rather than just the direct emissions within the Broads Boundary.
For further details on this calculation methodology see the Smallworld Report (PDF).
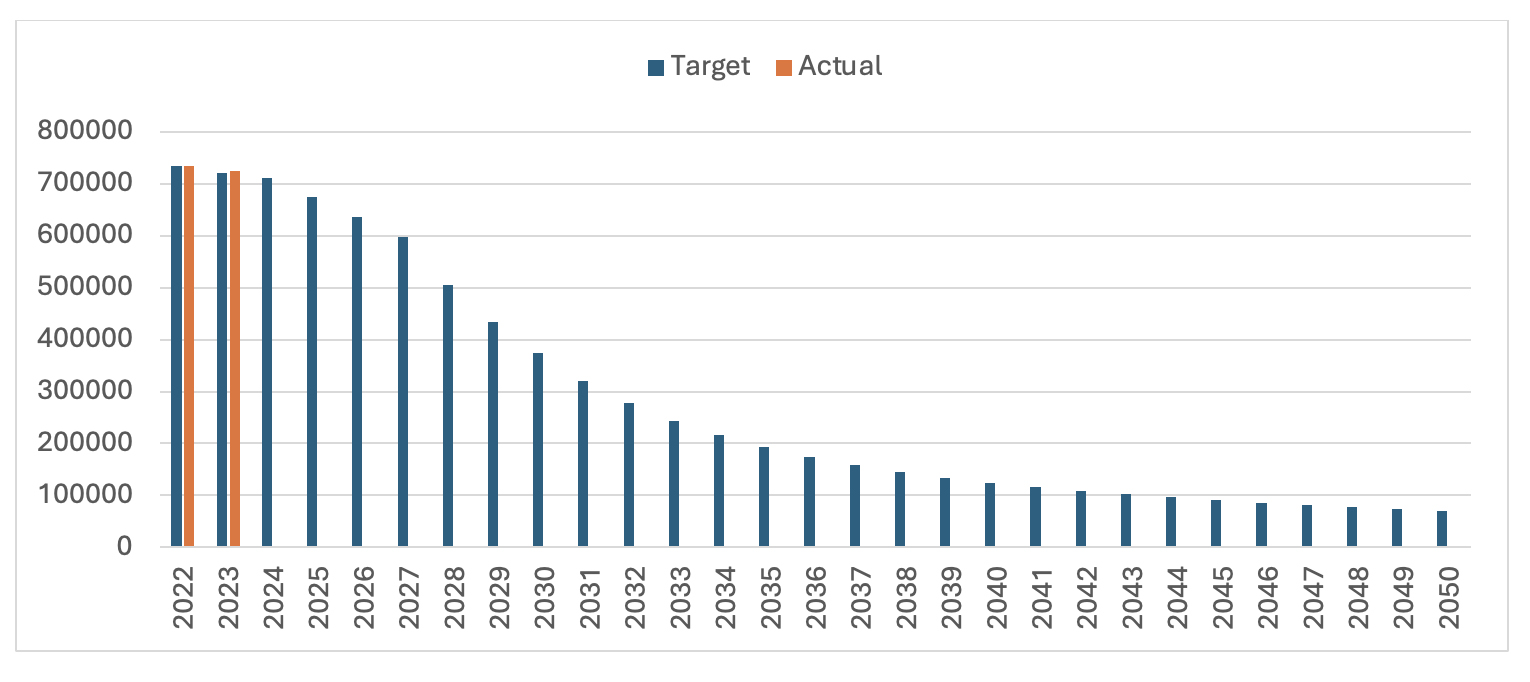
Our 1.7 degree global warming pathway to 2050 is set out below. Please note that this does not run to zero as the land emissions of the Broads do not become carbon sinks within this timeframe.
For more details please see the Smallworld Report (PDF).