Deer surveys
As well as in many other lowland areas across the UK, populations of deer have been present in the Broads area for many years.

Historically, their population has been relatively low and they have had minimal impact on the landscape. However, since 2005 the number and range of deer has increased across many areas of East Anglia, and the population is now higher and is more widespread than at any time in recent history.
With the support of landowners and the public, we are surveying deer numbers and assessing the impact on wetland habitats in the Broads area. This will inform landowners what controls are required in the future.
Impacts of deer
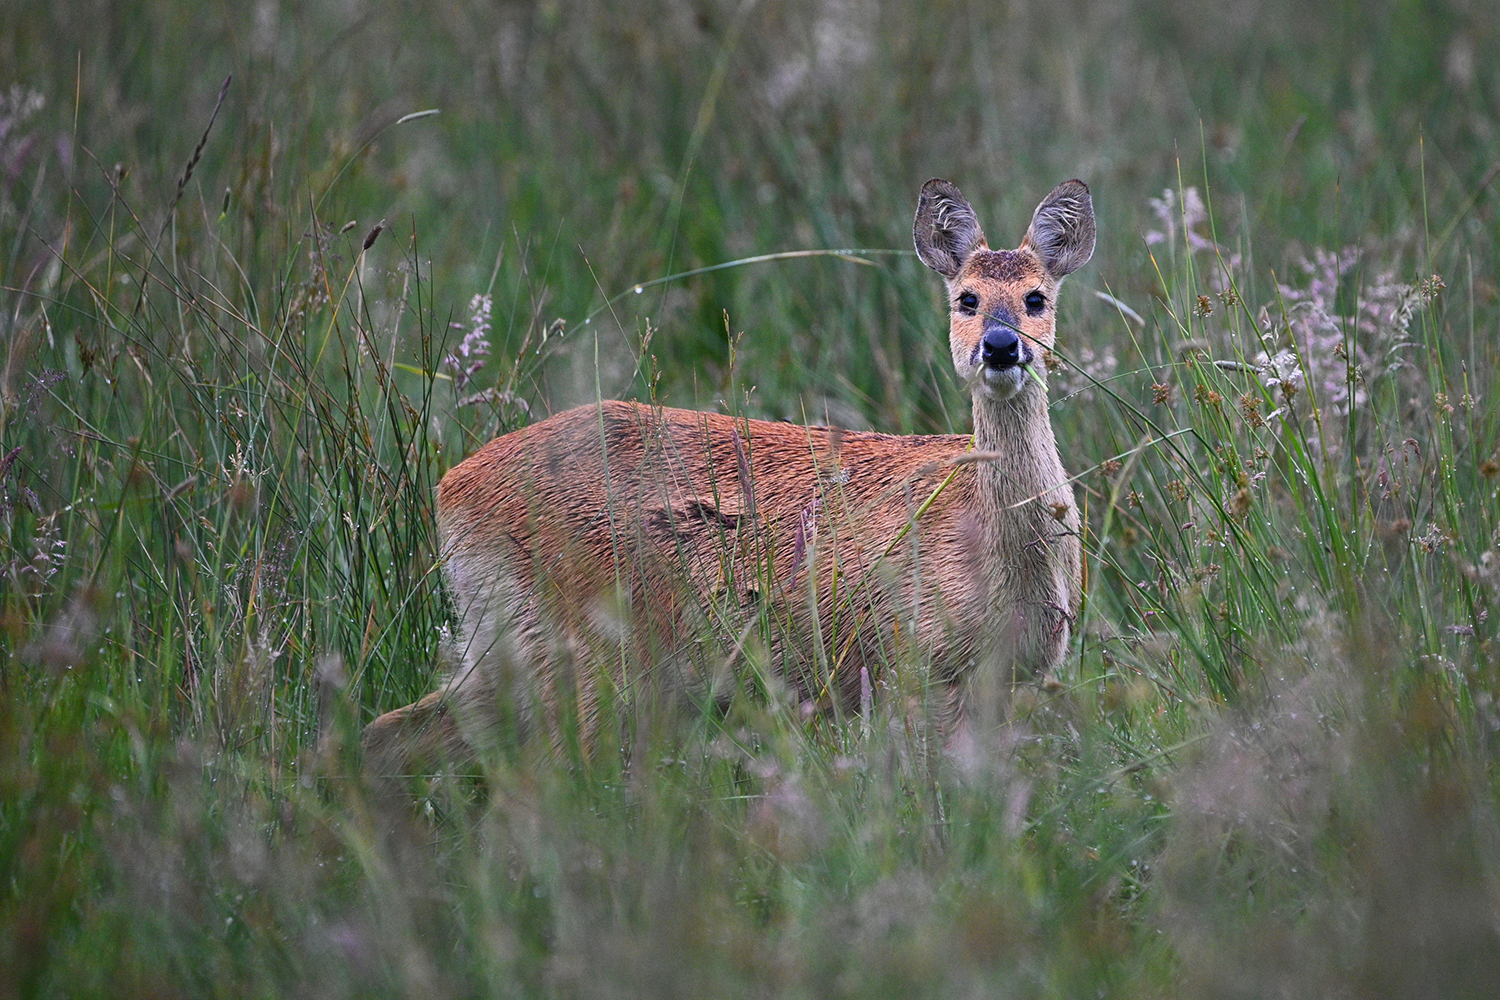
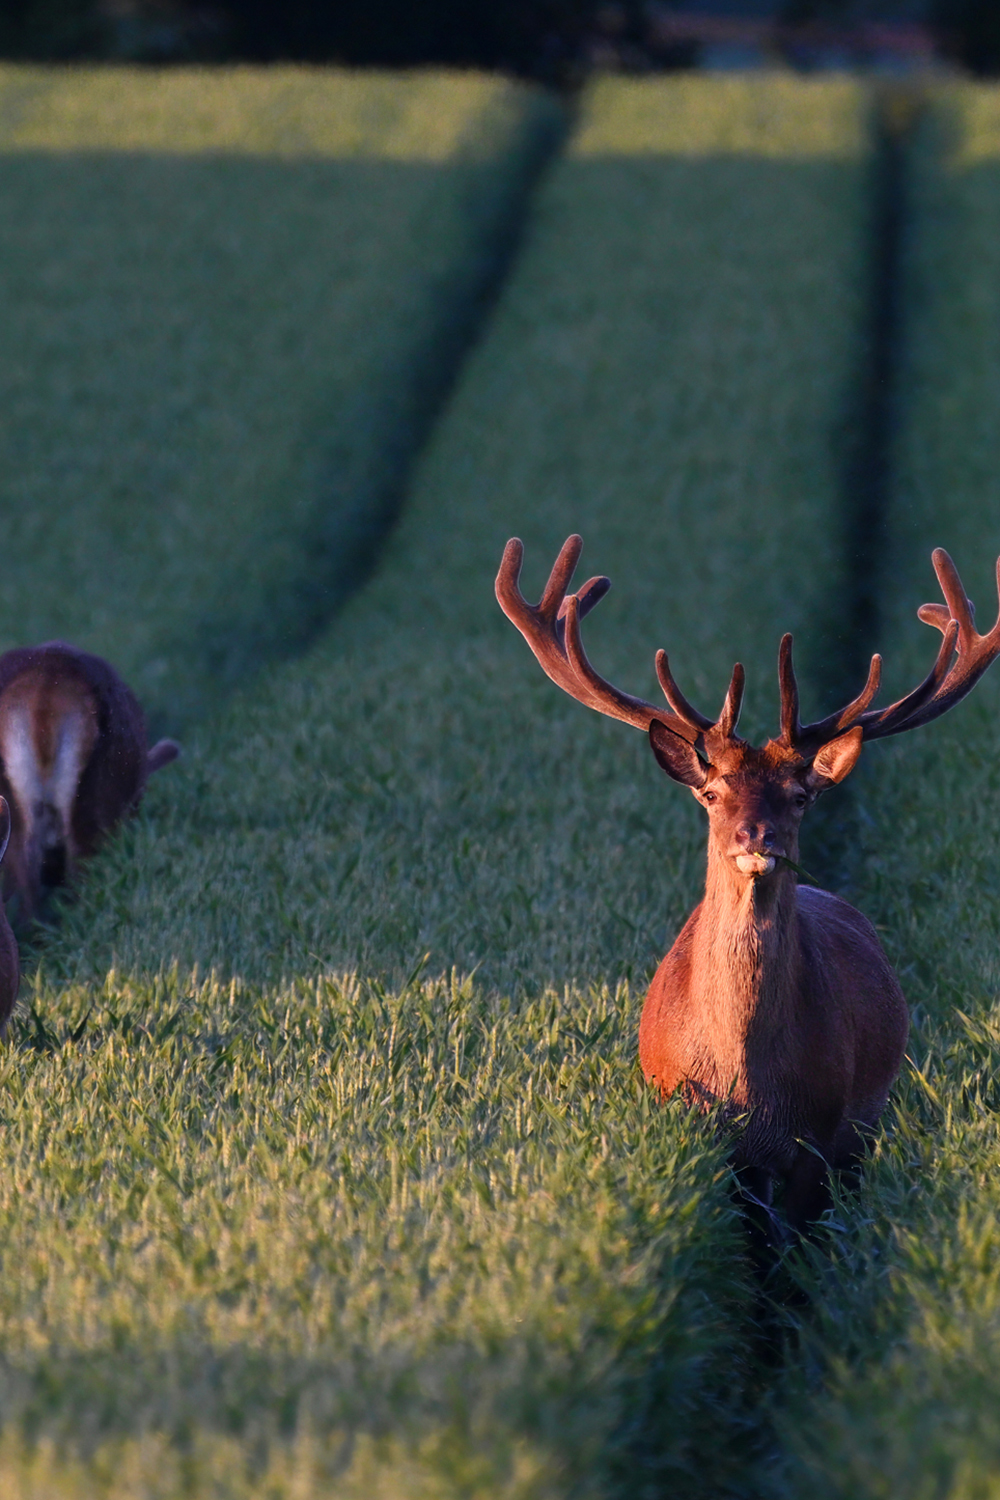
Whilst many people are happy to spot deer on their visits to the Broads, the negative impacts from Red deer (Cervus elaphus), Chinese water deer (Hydropotes inermis) and Muntjac deer (Muntiacus reevesi) have reportedly increased. This has resulted in an increasing awareness of the need for a more effective control plan.
A new report into the impacts of deer on wetland habitats in the Broads National Park (PDF), commissioned by the Broads Authority, consolidates evidence from land managers, existing literature, and direct measurements to assess the impact of deer on the Broads National Park. The findings highlight significant negative effects, particularly on fen and woodlands, which are strongly impacted by deer activity.
Almost all fen areas show high levels of damage, with tracks and wallows causing considerable disruption to habitat structure and composition, as well as significant harm to fen plant communities. Observations of weaker reed growth and selective grazing are also concerning. Additionally, the physical damage caused by tracks limits access for management activities, which could compromise the ongoing care of protected sites and threaten their overall condition.

The primary driver behind concerns around deer populations is their appetite. Some species of deer can eat over 7kg of food a day, which is often sourced from woodlands, cereal crops and ornamental gardens.
Deer grazing, or 'browsing' of wetland plants, such as milk parsley which are shown to be targeted by Chinese Water Deer, tree saplings and other young vegetation poses a particular issue in our habitats where they may eat through significant amounts of low-lying vegetation. This selective browsing can negatively impact biodiversity and prevent the natural regeneration of our woodlands. Biodiversity impacts of deer grazing may also include a reduction in food sources and a decline in habitats for birds, insects and other mammals.
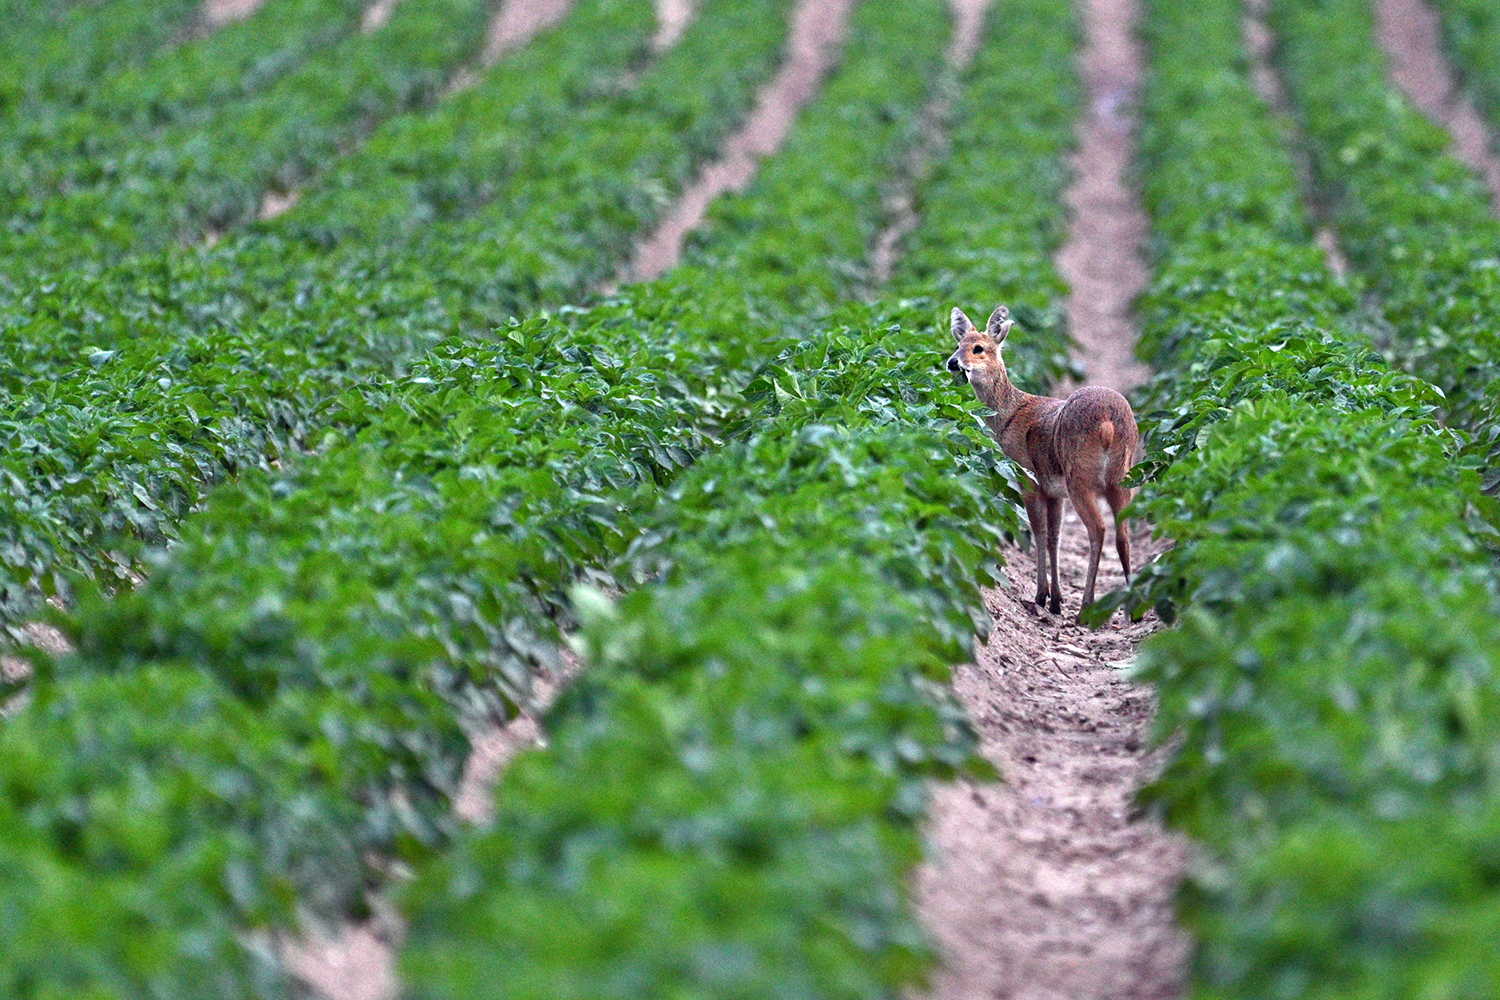
Deer can also create significant losses for farmers and land owners. They are known to feed heavily on cereal (arable) crops such as wheat, corn and barley, as well as on vegetable crops.
A final consideration is the potential increased likelihood of road traffic accidents and near-misses where areas that have a high population density of deer are intersected by roads and other rights of way.
Deer have no natural predators in the UK and so there are increasing applications to manage deer populations to protect arable crops, woodlands, reed beds, wider biodiversity and road users. Even with this in place the population of deer is continuing to increase in the Broads area.
Deer surveys
There is evidence that the deer population in the Broads area has increased, but no formal landscape scale assessment of numbers nor recorded impacts has occurred.
A drone survey has been completed in 2024 and 2025, at no cost to the landowners in the area, which provides an estimate of the minimum population of deer in the Broads area.
Who organised the surveys
A partnership between the Broads Authority, the Forestry Commission and Norfolk FWAG has provided the opportunity to undertake night and day time thermal drone counts of deer populations in the area. Surveys have been funded by a Farming in Protected Landscape grant and the Forestry Commission.
Natural England Assent was gained to undertake the survey work across protected sites, so that the survey will not adversely affect any of the important wildlife features in the area.
How the surveys take place
The surveys in February 2024 and March 2025 are during dawn and dusk. Drones are operated by Ben Harrower Wildlife Consultants. The drones are equipped with high tech thermal and high definition cameras.
Outcomes of the surveys

The count maps the range of the population, and give overall minimum population sizes.
The total number of deer surveyed within the landscape was 4,452. The number of Chinese Water deer was by far the highest with 1,997 – accounting for nearly half of all deer counted. Red deer were the second most common deer recorded with 1,172, this is followed by Muntjac 1,028 and 255 Roe deer. The surveyed area was approximately 203km2. Giving an overall deer density (allowing for exclusion areas) of almost 17 per km2 which classes as high.
In 2025 the total number of deer surveyed within the landscape was 4,765. The number of Chinese Water deer was by far the highest with 2,120 – accounting for nearly half of all deer counted. Red deer were the second most common deer recorded with 1,184, this is followed by Muntjac 1,104 and 322 Roe deer. The surveyed area was approximately 240km2. Giving an overall deer density (allowing for exclusion areas) of almost 20 per km2 at a time of year when the population is at its lowest (following winter management and before summer recruitment).
It’s worth noting that some areas within the landscape had very few deer present, particularly on agricultural land that had little woodland or cover, whereas the highest densities were detected in the wet woodland and reed beds where Chinese water deer were found in densities exceeding 100 deer per km2 in places.
The information gathered has been provided to landowners to support them with their ongoing landscape management work, to grow crops, enhance wetland and woodland condition, and increase the wider biodiversity of the landscapes.
Support the project
To help discuss this information with landowners and support them with their ongoing landscape management work and food production the Broads Authority held workshops in May and September 2024. Over 60 people attended, including stalkers and landowners including conservation organisations, everyone was engaged on the topic.
Broads Authority will continue to:
- Help coordinate partners and assist in gathering scientific evidence on the impact of deer on habitats in the Broads, particularly fens, reedbeds and wet woodlands, and work with funding partners to encourage financing of a monitoring programme.
- Assist in facilitation and guidance to landowners, helping to formulate a coordination group for Deer Management.
- Support the training and facilities for deer management via external funding, for example in 2024/25 through Farming in Protected Landscapes bids.
If you require any further information about the project or have any questions please contact:
- Andrea Kelly, Broads Authority Environment Policy Adviser, by emailing Andrea.Kelly@broads-authority.gov.uk
- David Hooton, Forestry Commission Deer Officer, by emailing David.hooton@forestrycommission.gov.uk
Further information
For further information on the impacts of deer please see:

